Good Friday evening to all of you here on r/StockMarket. I hope everyone on this sub made out pretty nicely in the market this past week, and is ready for the new trading week ahead.
Here is everything you need to know to get you ready for the trading week beginning October 4th, 2021.
October may have a bad reputation, but stocks are entering a normally positive period - (Source)
October may have a bad reputation, but the fourth quarter has mostly been a positive time for stocks.
Despite worries about central bank tightening, the debt ceiling, Chinese developer Evergrande and Covid-19, many strategists expect stocks to eclipse recent highs after a rocky period in October.
The S&P 500 has averaged outsized gains of 3.9% in the fourth quarter and was up four out of every five years since World War II, according to CFRA. The next best quarter is the first, with an average gain of 2.3%. The worst is the third, up just 0.6%.
“Q4 2021 will likely record a higher-than-average return. However, investors will need to hang on tight during the typically tumultuous ride in October, which saw 36% higher volatility when compared with the average for the other 11 months,” notes CFRA chief investment strategist Sam Stovall.
The S&P 500 eked out a small gain for the third quarter, but was down nearly 5% for the month of September, with a bad ending as the S&P 500 dropped 1.2% on Thursday.
The indexes kicked off the first trading session in October on a positive note, however. With the S&P 500 adding 1.1% and the Nasdaq closing 0.8% higher on Friday. The Dow Jones Industrial Average added 482.54 points.
https://i.imgur.com/FEg9jmU.png
Bespoke Investment Group analyzed the behavior of the S&P 500 in years when it was up solidly year-to-date heading into the fourth quarter. In those years, the market typically gained in the quarter, but there were weaker than normal returns in October and the quarter itself, when September was a negative month.
“The S&P 500 has been down in September 50 times since 1928, and in those years, it has actually averaged a decline of 0.41% in October and a gain of just 0.75% in Q4,” Bespoke noted. When September’s performance was positive, the S&P gained a much stronger 1.6% average in October and an average 5% in the fourth quarter, according to the firm.
Bespoke found that while October is remembered for stock market crashes, like those in 1929 and 1987, the market is usually positive. The Dow, for instance, gained 60% of the time in October over the past 50 years, averaging an increase of 0.5%. It was negative most of the time in September, with an average loss of 0.9%.
Jobs, jobs, jobs
One of the first hurdles markets face in the new quarter is Friday’s employment report, potentially one of the final triggers for the Federal Reserve’s decision on when to taper its $120 billion-a-month bond buying program.
Economists expect about 475,000 jobs were added in September, according to an early consensus figure from FactSet. Just 235,000 payrolls were added in August, about 500,000 less than expected.
“The only way I could see them delaying the tapering is if we get a very weak number, something closer to zero,” said Ethan Harris, head of global economic research at Bank of America. “Anything that looks like 100,000, 200,000, they just go ahead” with the taper.
Harris said the biggest concern for the economy remains Covid, though new cases are slowing.
“The big question is when does the Covid story start to fade a bit, allowing activity to come back,” he said. He expects the pandemic will continue to be a big factor in the labor market in September.
“We think fear of getting Covid on the job was a big factor in August and will be a factor in September as well,” he said. “By October, the early hints are people are starting to feel more comfortable and you should get some beginnings of a reacceleration of job growth.”
The market got some positive news on that front on Friday with Merck’s promising data for its Covid antiviral pill.
Central banks tightening
A big event in the fourth quarter could be the beginning of the unwind of the Federal Reserve’s easy policies.
The central bank last week signaled it is nearly ready to take that first step away from the policies used during the pandemic to maintain financial market liquidity and help the economy.
The Fed is widely expected to announce in November that it will start to slow its bond purchases, and Fed Chairman Jerome Powell said he expects it to finish by the middle of next year.
Other central banks around the world are also making the same noises or actually moving to raise interest rates. Bond market pros now expect a trend toward higher interest rates.
Just in the past week, rates shot higher, with the 10-year Treasury yield rising from about 1.31% while the Fed was meeting Sept. 22 to as high as 1.56% just a week later. On Friday, the yield eased back a bit to just under 1.50%.
https://i.imgur.com/9dO7jZc.png
The move toward tapering so far has not had much impact on markets, though strategists say it could if yields shoot higher. The bond buying program, or quantitative easing, was also credited with providing market liquidity, which has been fuel for stock market gains.
“The Fed is trying very hard to telegraph what they are doing well in advance and take the shock out of what they’re doing. Bond yields have gone up a bit but not in a way that’s troubling for the economy,” said Harris. “The real risk from the Fed comes when they start talking about hiking interest rates. ... That’s a story for next year.”
Rising yields would become more risky for stocks if they were to continue to move up rapidly. Tony Crescenzi, PIMCO executive vice president, said he expects the benchmark 10-year Treasury yield to trade in a range of 1.50% to 2% this year.
Crescenzi said the move higher in yields has to do with more persistent inflation expectations and the Fed’s persistent move toward less easy policy. “It’s still marching forward with its plan to taper and eventually tighten,” he said. “The taper doesn’t set a date for tightening, but the clock starts ticking once the taper begins.”
The jump in rates rattled stocks in the past week, particularly tech stocks. The S&P 500 was lower by 2.2% for the week and the Nasdaq shed 3.2%.
Surprising earnings
Earnings have been a big catalyst for the stock market, with huge upside surprises boosting sentiment this year. But some strategists warn that if companies sound too cautious when they report third-quarter profits in the next couple of weeks, that could be a forewarning for the market.
Julian Emanuel, head of equity and derivative strategy at BTIG, said rising earnings estimates for this year and next year have been a tailwind. “Those in our view have now plateaued and potentially peaked,” he said. “If the market perceived they peaked rather than plateaued on a near to medium-term basis, then we have a problem for the stock market.”
Investors are also watching the supply chain issues that are disrupting many companies’ ability to get parts and even products. They are already impacting earnings and pressuring margins. Some have already warned about the problem, and more are expected to detail the issues during earnings calls.
Congress averted a government shutdown, but political feuding is likely to hang over the markets in the fourth quarter. The bigger task facing lawmakers will be to raise the debt ceiling, which could become worrisome for markets if the government reaches the limit before action is taken.
As the fourth quarter moves ahead, the fate of the proposed $3.5 trillion infrastructure plan, which is opposed by Republicans and some Democrats, remains up in the air. Bank of America’s Harris said he expects it to be cut back to about $1.5 trillion.
Other issues
Chinese property developer Evergrande’s failure to make its debt payments temporarily spooked the market in September. Its problems are not solved even as investors expect that a financial meltdown will be averted.
Evergrande’s progress will remain an important story for the markets in the fourth quarter, as the company struggles under its $300 billion debt burden.
This past week saw the following moves in the S&P:
S&P Sectors for this past week:
Major Indices for this past week:
Major Futures Markets as of Friday's close:
Economic Calendar for the Week Ahead:
Percentage Changes for the Major Indices, WTD, MTD, QTD, YTD as of Friday's close:
S&P Sectors for the Past Week:
Major Indices Pullback/Correction Levels as of Friday's close:
Major Indices Rally Levels as of Friday's close:
Most Anticipated Earnings Releases for this week:
([CLICK HERE FOR THE CHART!]())
(T.B.A. THIS WEEKEND.)
Here are the upcoming IPO's for this week:
Friday's Stock Analyst Upgrades & Downgrades:
Mega Caps Underperforming as Energy Explodes
In November of last year, we took a look at the performance spread between the equal and market cap weighted versions of the S&P 500. The chart below provides an update through the end of September where positive readings indicate outperformance of the equal-weight S&P 500 and negative readings indicate outperformance of the market cap weighted index. In March 2020, as the market was plunging from the February peak and bottoming towards the end of the month, mega-caps such as Apple (APPL), Microsoft (MSFT), Alphabet (GOOGL), Amazon (AMZN), and Facebook (FB) significantly outperformed the broader market, resulting in a 5.68 percentage point spread between the return of the equally weighted and market cap weighted S&P 500. Whereas the equal-weighted index declined 18.19% in March 2020, the market cap weighted index dropped 'just' 12.51%. In a reversal of these trends, the equal-weighted index outperformed between the months of September 2020 and March 2021, rallying 30.84% while its market cap weighted counterpart gained 18.14%. Over these months, there was a maximum monthly spread of 3.37 percentage points in favor of the equal-weighted index, which occurred last December. In recent months, mega-caps briefly took back the reins before the trend reversed in September when the equal-weighted index outperformed by 0.82 percentage points.
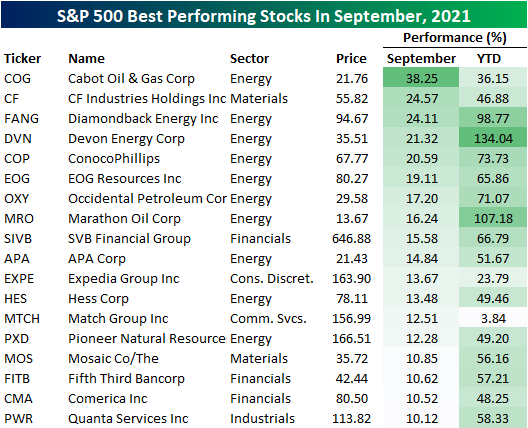
With the month of September behind us, the table below lists the 18 stocks in the S&P 500 that finished the month up over 10%, and less than a quarter of the stocks in the index (22%) finished the month higher. Overall, the average performance of stocks in the index was a decline of 3.7 percentage points. While short-term performance has been weak, on a YTD basis, 81.42% of S&P 500 stocks are up on the year, and the overall average gain is 18.90%. Of the stocks that have rallied 10%+ in September, more than half are from the Energy sector and another three come from the Financials sector.
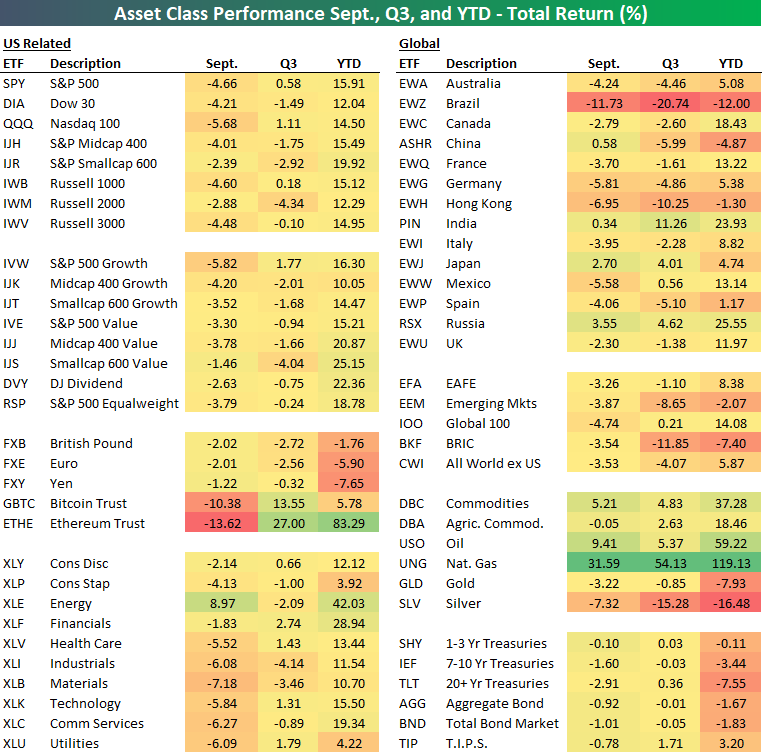
Q3 Asset Class Performance
Q3 and the month of September are now in the books, and it was not a great period for US equities. As shown in our asset class performance matrix below, the sole portion of the US equity market that was higher in September was Energy stocks. Every other sector, theme, and major index was lower on the month. As for global equities, performance was more mixed with declines ranging from 11.73% for Brazil (EWZ) to a 3.55% gain for Russia, though, most country ETFs were lower on the month.
Commodities had a good month particularly in the energy space with crude oil (USO) gaining 9.41% and Natural Gas (UNG) rising an astounding 31.59%. That lifted the total gain in Q3 to 54.13% while it has returned almost 120% year to date; the best performer for both time periods. Precious metals, namely silver (SLV), on the other hand, was hit particularly hard. As for cryptos, Ethereum (ETHE) was another top performer YTD and in Q3, but September pared those gains. ETHE fell 13.62% in September while Bitcoin (GBTC) also fell by double-digit percentages.
Could There Be An October Crash?
“October: This is one of the peculiarly dangerous months to speculate in stocks. The others are July, January, September, April, November, May, March, June, December, August and February.” Mark Twain
Well, it was bound to end eventually, but the S&P 500 Index will finish September in the red, ending an incredible seven month win streak. As we noted last month, these long win streaks actually tend to be quite bullish for future returns, with the S&P 500 higher six months later 13 out of 14 times. Yes, stocks were down some in September, but this still bodes well for the near-term.
Speaking of the near term, here comes October. As Marc Twain explained many years ago, October has long been a source of anxiety for stock investors. “October is known for some spectacular crashes and many expect bad things to happen again this year. 1929, 1987, and 2008 all come to mind when we think about this month,” explained LPL Financial Chief Market Strategist Ryan Detrick. “But the truth is this month is simply misunderstood, as historically it is about an average month.”
As the LPL Chart of the Day shows, since 1950, October ranks as the 7th best month, while the past 10 and 20 years it ranks as the 4th best month. In a post-election year it comes in 5th. So October clearly isn’t one of the best months of the year, but by no means is it the worst either.
Now, let’s be very clear though, October is known for volatility. No month has seen more 1% moves (up or down) than October, with some of the largest 1-day moves (both up and down) taking place this month. Heck, the S&P 500 hasn’t had a 5% pullback all year (the average year sees about three) and the last one was nearly a full year ago, one of the longest such streaks ever. Not to mention the S&P 500 has now gone an incredible 317 trading days in a row above its 200-day moving average, one of the longest streaks ever. What we are getting at is a 5-7% pullback could potentially come at any time given we haven’t had one in so long.
Here are some other interesting statistics to think about regarding the S&P 500 in October. * It has been 21 years (2000) since October didn’t close at least up or down 1%. Several percent moves up or down are quite common for this month in other words. * For six years in a row October has alternated between higher and lower. Given 2020 it was in the red, it could be time for a bounce in 2021. (More on this below) * The last two times the S&P 500 was up more than 15% year-to-date heading into October, stocks gained each time (2013 and 2019). * The author’s birthday is on October 28, one of the historically most bullish days of the year. Coincidence? It turns out stocks don’t like politics much. The S&P 500 performs much better in odd numbered years than even years. Remember, even numbered years have elections and midterms in November. Some pre-election jitters makes sense to us, which could bode well for 2021.
Don’t forget the fourth quarter is historically the best for stocks, with the third quarter the worst. Stocks rise 3.8% on average during the fourth quarter, but the past seven times the S&P 500 was up 15% year-to-date heading into the home stretch of the year, the fourth quarter was higher every single time, up a very impressive 5.8%. In other words, should there be any October scares, investors may want to use the weakness as an opportunity to add to core positions.
Four Charts That Signal the Reopening Trade May Be Back
Stocks have come a long way since the S&P 500 bear market low way back on March 23, 2020, but despite the general strength of the bull market we’ve seen two very different types of trades leading markets at different times. They include a “work-from-home” trade characterized by strength among large caps and growth-style oriented stocks, strong performance by U.S. stocks in particular, and well contained interest rates. At other times, we’ve seen a “reopening trade,” where mid- and small-cap stocks have performed well, cyclically-oriented value-style stocks have led, interest rates have pressed higher, and performance across geographical regions has been more even. For most of the last six months the work-from-home trade has dominated, but we’re seeing some signs of potential rotation toward a reopening theme once again.
“It’s increasingly looking like the Delta-related surge in COVID-19 cases, while still dangerous, has passed its peak, and there are signals that markets may be anticipating the next stage of economic reopening,” said LPL Chief Market Strategist Ryan Detrick. “After a mid-summer head fake, we’re seeing signs that this time the rotation might stick.”
It all starts with interest rates. The 10-year Treasury yield started to stabilize in early August, and since then we’ve seen steady movement higher as elevated inflation looks increasingly sticky in the near term, and markets start to anticipate global central bankers slowly winding down extraordinarily supportive monetary policy. The full transition to neutral policy will likely take years, and central banks will remain supportive for some time, but the change in direction does matter. Seeing the 10-year yield move higher despite stock losses on Tuesday may be a telling sign.
A higher 10-year Treasury yield has supported financial sector stocks, which are the largest sector in the Russell 1000 Value Index. The breakout in relative strength compared to the August peak may signal a more sustainable change in direction this time.
It’s still too early to call a reversal by value-style stocks overall, but financial sector strength helps. Rising interest rates also tend to increase the value of near-term earnings over less visible long-term earnings growth, which may also give value stocks an edge. While there are some signs of a reversal higher in the value trade, what we’ve seen so far isn’t persuasive in isolation. But added to the broader market signals, we see potential for further relative strength, particularly for cyclical value sectors.
The relative strength of small caps looks more robust, breaking out to the upside after treading water for several months. Small caps went through a stretch of extraordinarily strong performance between September 2020 and March 2021, and it’s not completely surprising that they gave back a good share of those gains after coming so far so fast, but we still think the economic environment is likely to be supportive for small- and mid-caps compared to large.
We’ve been anticipating a rotation back to the reopening trade for some time. If you look at the charts there’s really been relative stability between the two themes since mid-July, but the last few weeks have provided solid signals of a potential reversal. With the latest surge in COVID-19 cases likely past peak, vaccination rates slowly rising, and economic surprises starting to come back into balance after a series of disappointments, it’s no surprise to see the shift toward the reopening theme.
But there are some potential economic negatives that support this trade as well, such as high commodity prices, higher interest rates, and growing risk of stickier inflation. Nevertheless, we think the fundamental backdrop for equities remains positive on the whole, and we continue to recommend modest overweights to equities while leaning into cyclically-oriented value sectors and tilting away from large caps.
STOCK MARKET VIDEO: Stock Market Analysis Video for Week Ending October 1st, 2021
STOCK MARKET VIDEO: ShadowTrader Video Weekly 10.3.21
([CLICK HERE FOR THE YOUTUBE VIDEO!]())
(VIDEO NOT YET POSTED.)
Here are the most notable companies (tickers) reporting earnings in this upcoming trading week ahead-
([CLICK HERE FOR NEXT WEEK'S MOST NOTABLE EARNINGS RELEASES!]())
(T.B.A. THIS WEEKEND.)
([CLICK HERE FOR NEXT WEEK'S HIGHEST VOLATILITY EARNINGS RELEASES!]())
(T.B.A. THIS WEEKEND.)
Below are some of the notable companies coming out with earnings releases this upcoming trading week ahead which includes the date/time of release & consensus estimates courtesy of Earnings Whispers:
Monday 10.4.21 Before Market Open:
([CLICK HERE FOR MONDAY'S PRE-MARKET EARNINGS TIME & ESTIMATES!]())
(NONE.)
Monday 10.4.21 After Market Close:
Tuesday 10.5.21 Before Market Open:
Tuesday 10.5.21 After Market Close:
Wednesday 10.6.21 Before Market Open:
Wednesday 10.6.21 After Market Close:
Thursday 10.7.21 Before Market Open:
Thursday 10.7.21 After Market Close:
Friday 10.8.21 Before Market Open:
Friday 10.8.21 After Market Close:
([CLICK HERE FOR FRIDAY'S AFTER-MARKET EARNINGS TIME & ESTIMATES!]())
(NONE.)
(T.B.A. THIS WEEKEND.)
T.B.A. THIS WEEKEND.) T.B.A. THIS WEEKEND.).
DISCUSS!
What are you all watching for in this upcoming trading week?
I hope you all have a wonderful weekend and a great trading week ahead r/StockMarket. :)